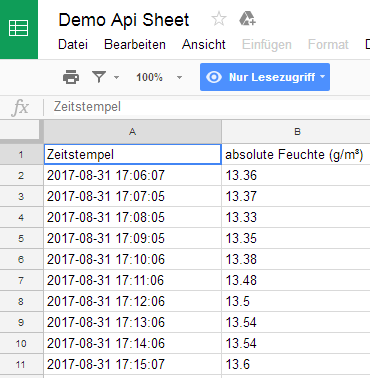
Applications for the Google Spreadsheet App
The App can be used in mans scenarions. For example:
- to save measurement vaues with historical values
- to analyze measurement data
- to visualize data,
- to make measurement data accessible via API for public web servcies or
- to integrate measurment data into websites.
Of course the measurment data can be downloaded in several file formats as .docx or .csv. In order to integrate measurment data in a website Google Spreadshee API can be used. There is plenty of documentation available and many samples. The measurement data can be accessed through the API by a PC software client, a website or any other API client.
To visualize measurment data on a website we recommend to use Google Charts. It is straight and easy to draw awesome charts to visualize the Google Spreadsheet data without deep programming know how. Build nice looking charts in a few minutes of your website – optimized for any display and device, More information on Google Charts is available here. We will write a blog post on how to build charts on a website later.
Your Feedback and comments are always welcome.